- Role
- Design + build, solo
- Context
- Personal project · live product
- Timeline
- June 2026 · running 24/7 since
- Stack
- TypeScript · Postgres · Next.js
01 · Overview
What Crosstown is
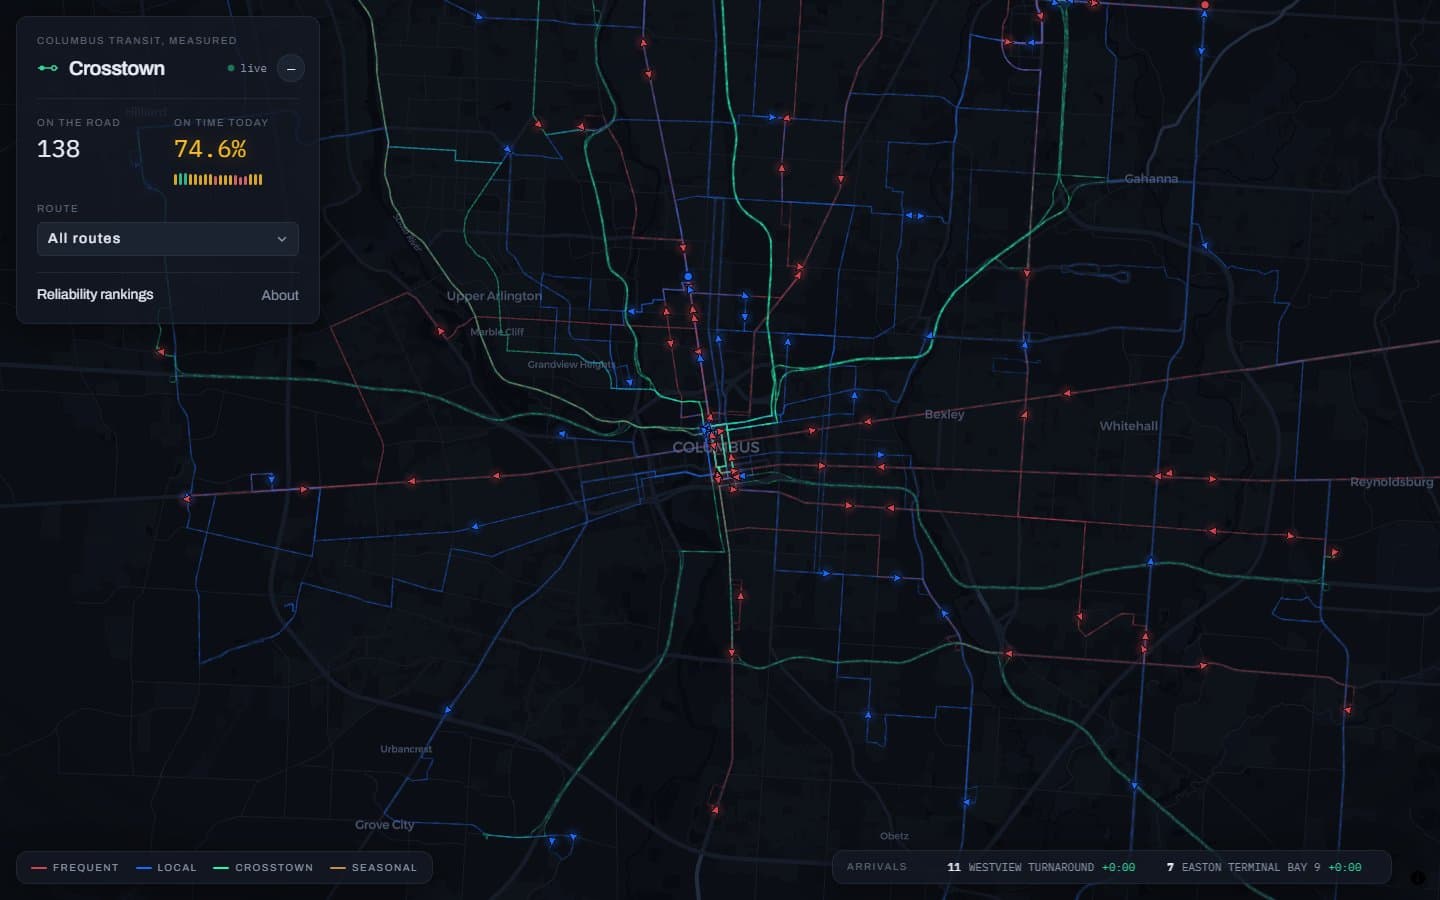
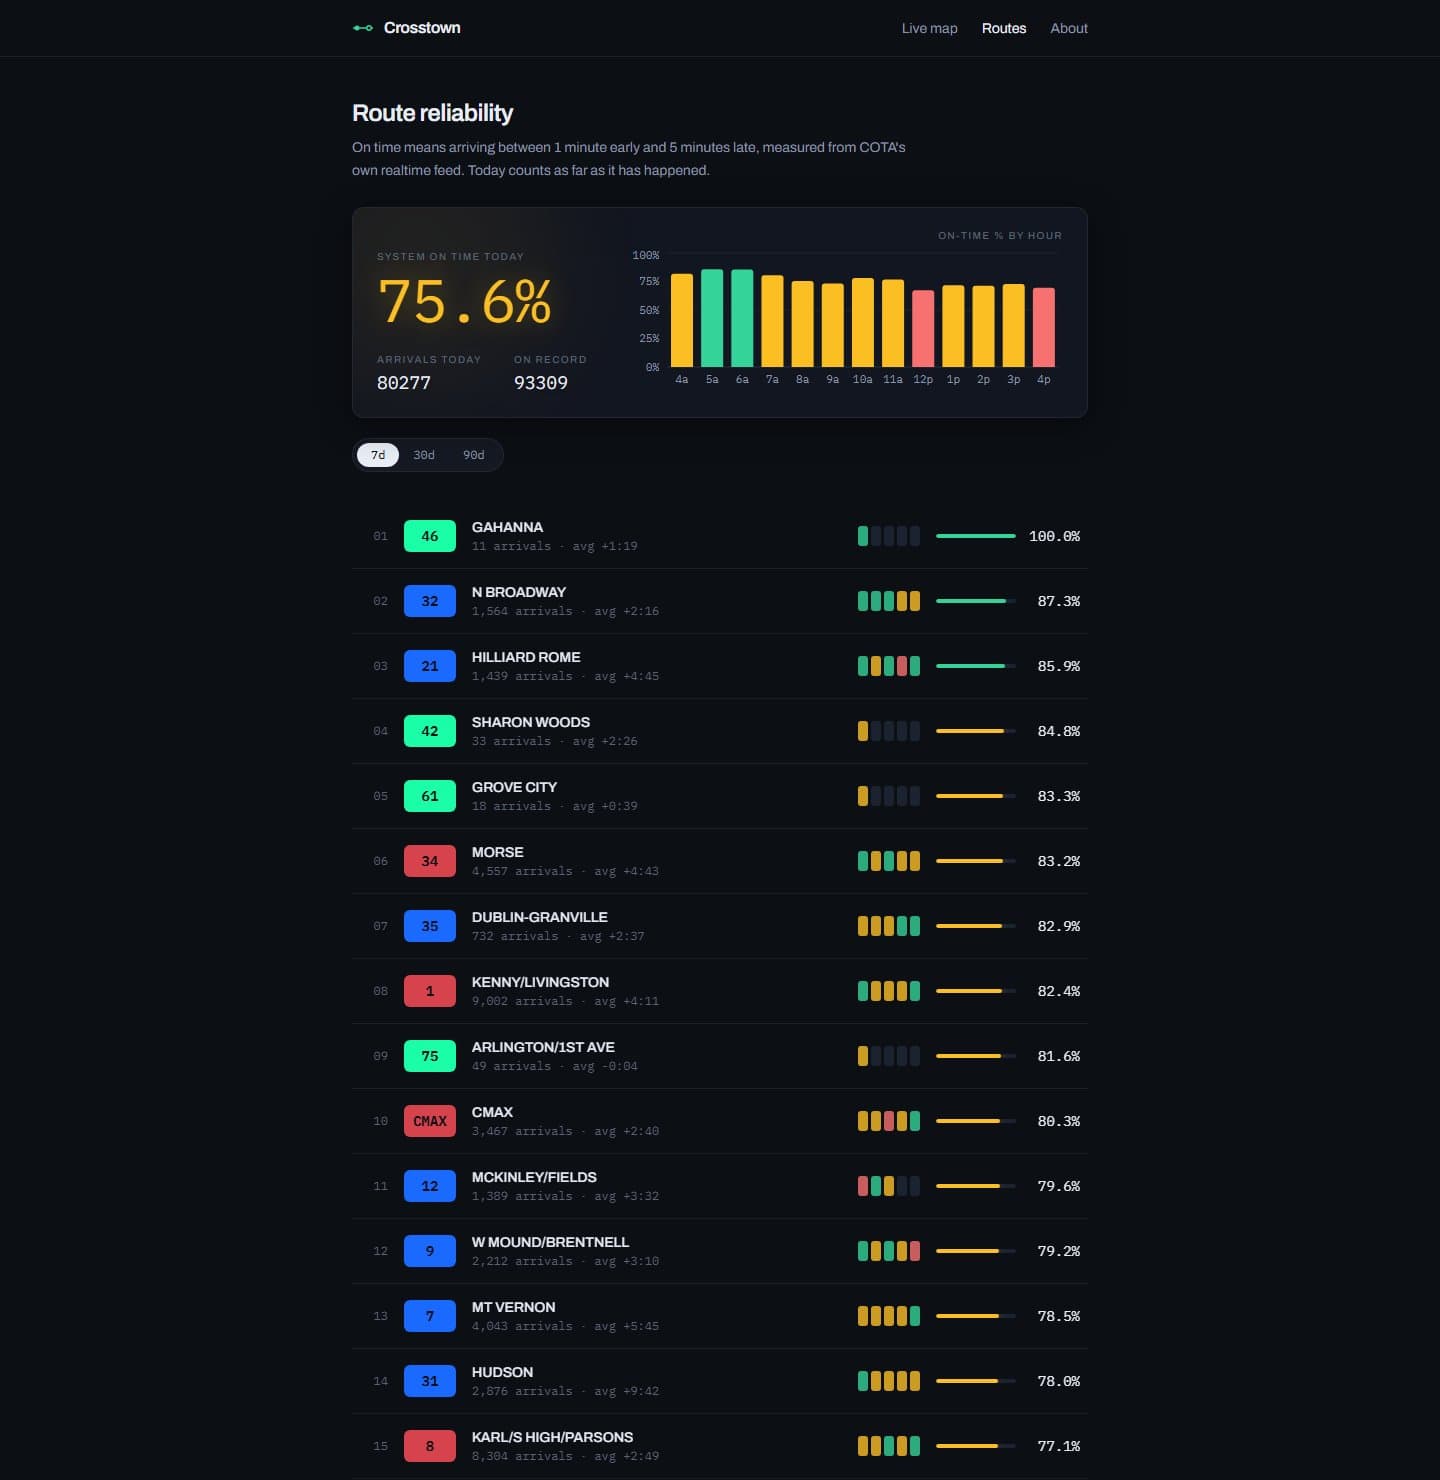
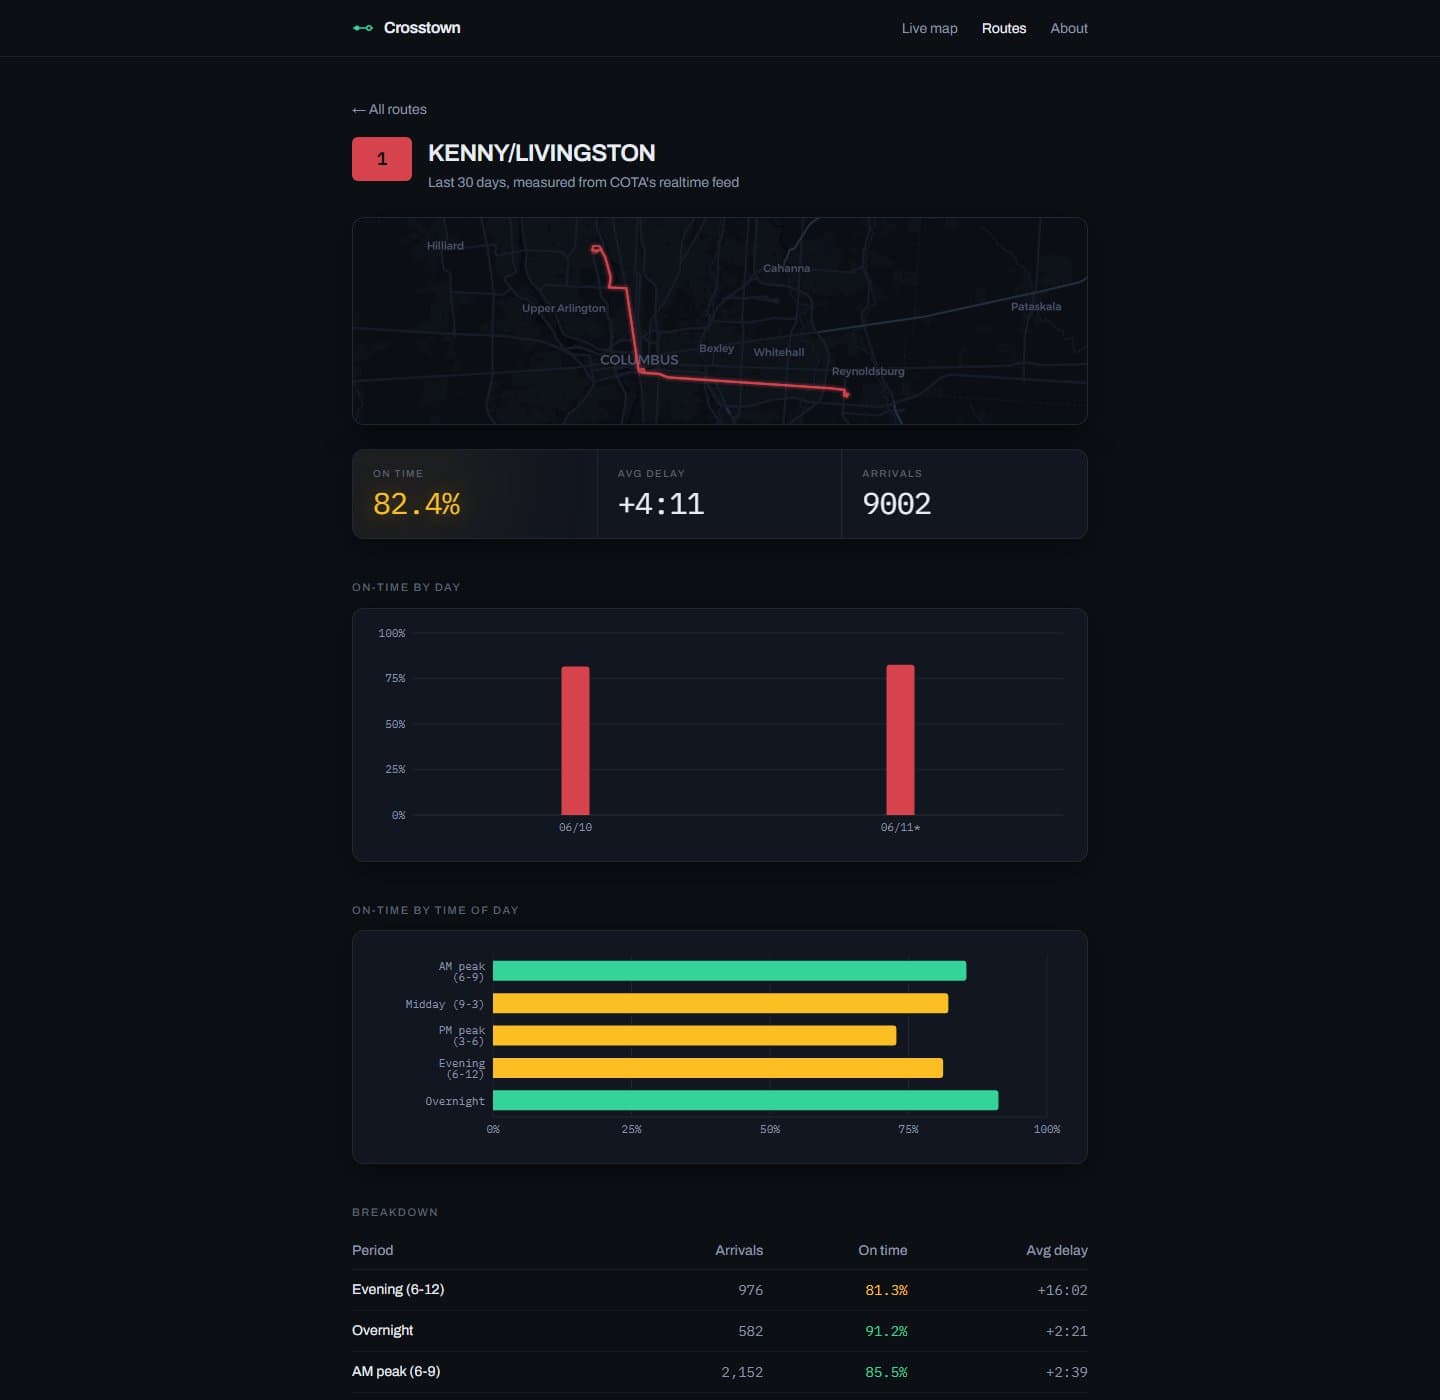
Crosstown answers one question: how reliable is each Columbus bus route? The schedule tells riders what should happen. Crosstown records what did happen, keeps it, and turns it into numbers people can use. The live map is the entry point. The record behind it is the product: every arrival the system has observed, rolled up into per-route and per-time-of-day reliability stats.
Crosstown focuses on measurement because COTA already tells you when the next bus is coming. What riders do not get is a history of whether a specific route keeps time at a specific hour. That takes months of records, so Crosstown keeps them: it has run around the clock since launch, and the dataset gets more useful each week without another line of code.
02 · Problem
The schedule is a promise nobody checks
Transit reliability data mostly evaporates the moment it exists. The arrival screens at bus stops show a prediction. The bus comes, or it does not, and the prediction is gone. If you want to know whether a route is dependable at rush hour, there is nothing to look up.
That gave the project its brief: ingest the city's realtime transit feeds continuously, score every arrival against the published schedule, keep the results, and make the methodology clear. Most of the engineering work came from making those records continuous and defensible.
03 · The system
A 24/7 pipeline on a $5 budget
One Node.js service polls COTA's GTFS-realtime protobuf feeds, writes to Postgres, and serves the API. It checks positions every 15 seconds and arrival predictions every 30, matching the feed's measured regeneration cycle. Conditional requests keep unchanged feeds cheap. Positions push to the browser over server-sent events, and the map interpolates motion client-side between updates so the buses glide instead of teleporting.
The parts worth digging into:
- The feed publishes no delays. COTA's feed carries predicted arrival times but leaves the delay field empty, and protobuf decoders return 0 for missing numbers, so naive code records every bus as perfectly on time forever. Crosstown computes each delay itself in SQL by joining every prediction against the 365,000-row published schedule. Service days start at noon minus 12 hours, so past-midnight trips and daylight-saving switches get their own integration tests.
- "Row exists" is not "event happened." Predictions are upserted until the bus passes the stop, so at any moment a quarter of the table is still forecasts. Every statistic filters to observed arrivals with an explicit predicate, which a data audit proved necessary: before it, the live numbers counted the future and flattered the system by two points.
- History is pre-aggregated. Raw positions live 48 hours, arrival records 90 days, and nightly rollups live forever, so the charts stay instant as the dataset grows and the database stays inside a $5 hosting plan. The rollup job is idempotent and runs hourly. The first run after midnight finalizes the day, so the system does not need a precise scheduler.
- Failure means a gap, not a crash. Every poll is isolated; a feed outage leaves a hole in the data and nothing else. Deploys reload the schedule automatically, so the static and realtime datasets can't quietly drift apart. That matters because the best-known public copy of COTA's schedule is a full schedule period stale, which cost me an evening once.
04 · Design
Night service, built like a control room
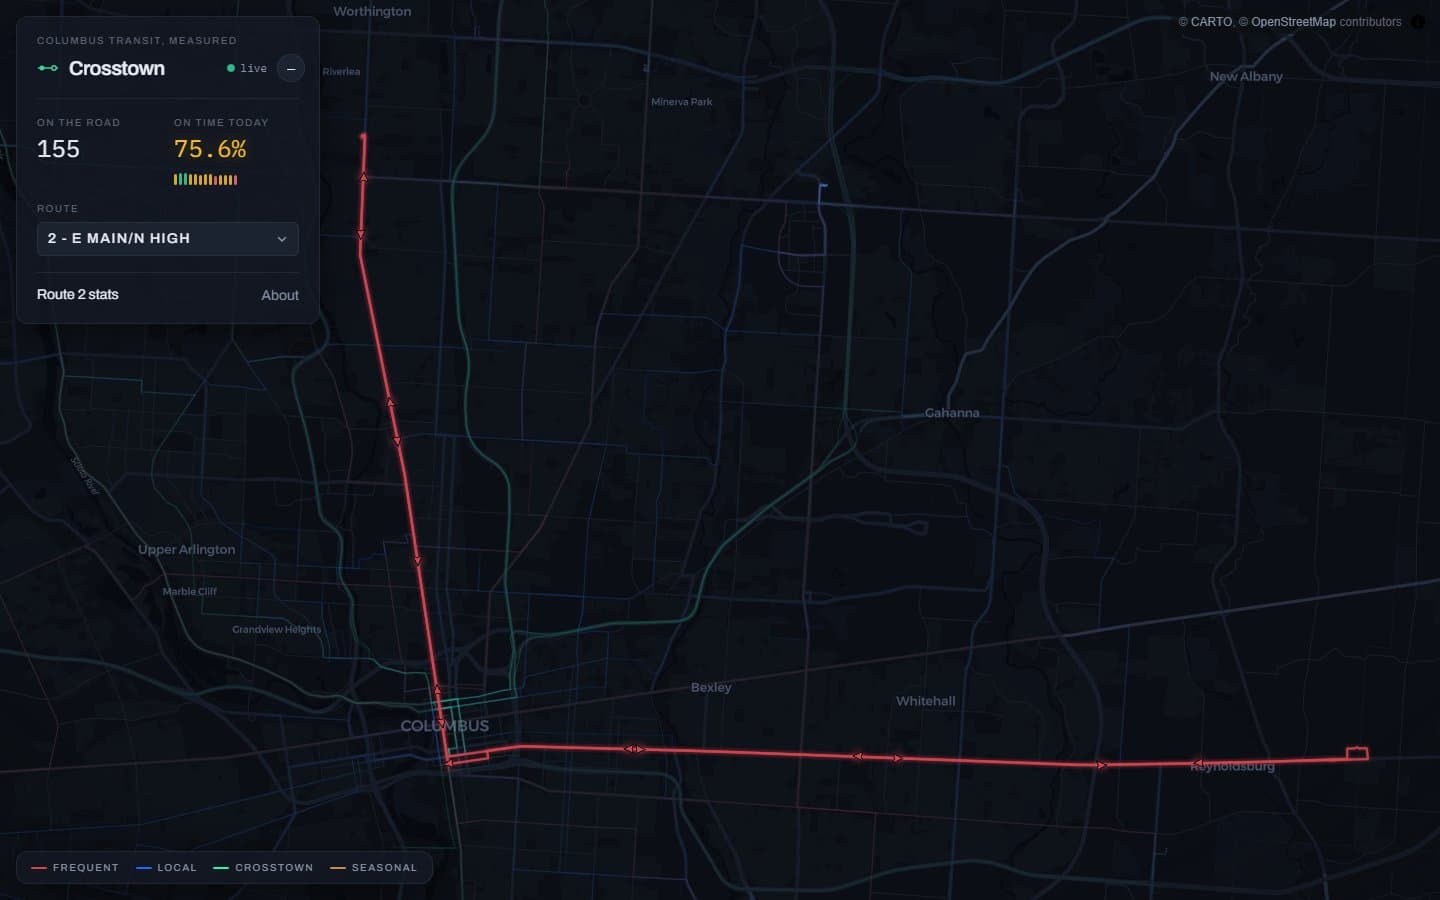
The design borrows from a transit control room at night: dark city, glowing data, deep ink surfaces, translucent panels, and hairline rules. Archivo handles the UI, and IBM Plex Mono handles the numbers. Color always means something. Route colors come from COTA's own palette, adjusted to stay readable on a dark map. The other saturated colors are reserved for reliability status.
Motion carries information too. Buses interpolate between GPS pings with comet trails, faint pulses drift along every route strand in the actual direction of travel, arrivals tick across a live feed as the system observes them. On load, the camera moves into Columbus while the network fades up. Every animation on the site falls back to a static render under prefers-reduced-motion.
05 · Decisions
The calls that shaped it
Measure, don't predict
Crosstown records what happened instead of trying to beat the agency's own arrival screens. Predictions expire every 30 seconds. A record gets more useful the longer it runs. That choice shaped everything downstream, from the methodology notes to what counts as an observation.
SSE over WebSockets
The realtime data flows one way, so the map uses server-sent events. It is plain HTTP, avoids proxy issues, and lets the browser reconnect by itself. The connection status shows up in the UI as a live dot that turns amber while reconnecting.
One process, one database, five dollars
The worker and the API share a process, retention windows bound every table, and reads come from rollups or in-memory caches. At larger scale I would split the worker from the API so a slow query could never delay polling. For this project, keeping them together made the product cheap enough to run continuously.
06 · Outcome
Live and recording
42 routes
Every COTA route, scored continuously
90k+
Arrivals on the record in the first two days
$5/mo
Total infrastructure, bounded by design
Crosstown went from first commit to live product in two days, and the dataset has been growing every minute since. It already answers specific questions: one crosstown route runs a +4 minute average delay across 9,000 recorded arrivals, while another keeps 96% of its scheduled arrivals on time. It is also the project where I owned every layer at once: the ingestion math, the database design, the API, and the interface.
Thanks for reading
Go watch the buses, or talk to me about the pipeline.